📋 Project Overview
A sophisticated web-based dashboard designed to monitor Intel-based MacBook Pro system metrics in real-time. The application provides comprehensive insights into CPU, GPU, SSD temperatures, thermal states, fan speeds, system performance, and network connectivity with an elegant, color-coded interface.
📅 Date: August 2025
⚠️ Problem: Lack of custom widgets on older Mac OS versions
🎯 Purpose: Local laptop real-time system monitoring and performance visualization
🔧 Platform: Intel-based MacBook Pro
📱 App Screenshots
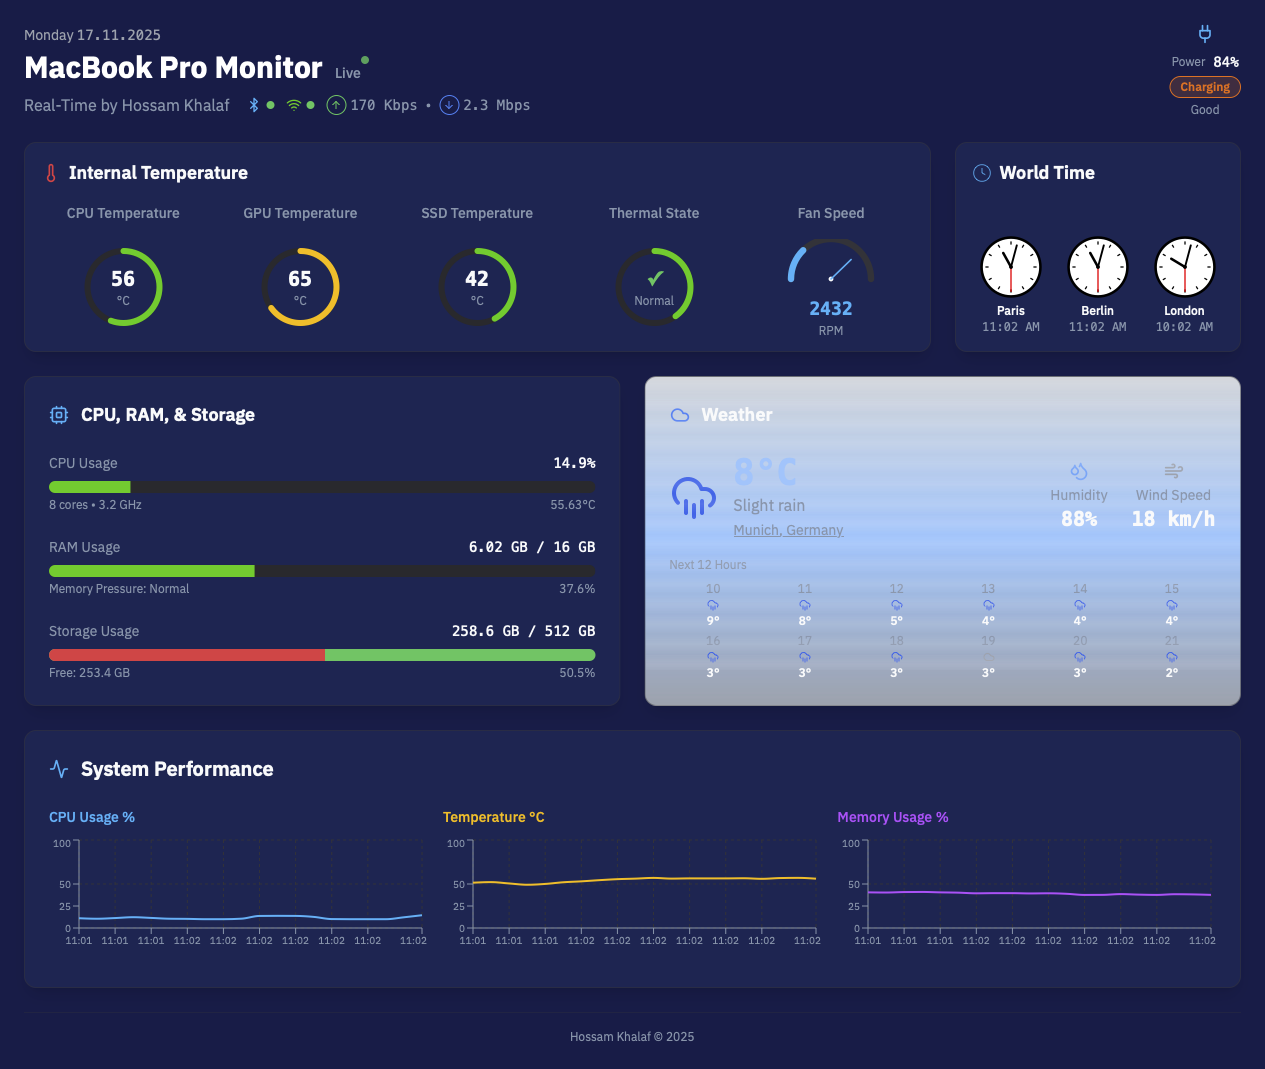
Full Dashboard View
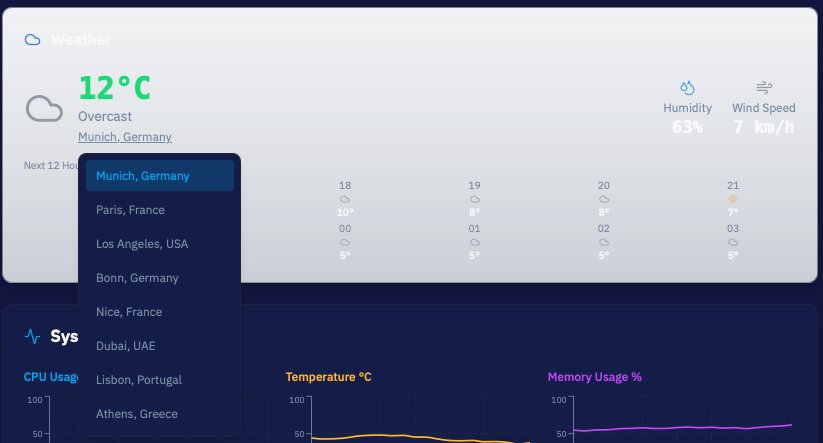
Weather with Editable City List
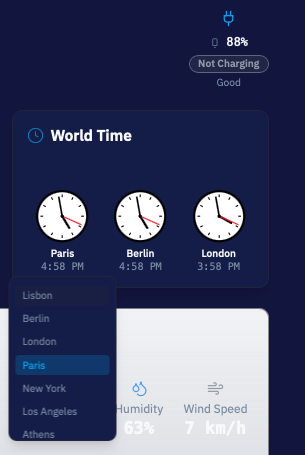
World Clock with Editable City List
Full Dashboard View
Weather with Editable City List
World Clock with Editable City List
✨ Key Features
🌡️ Temperature Monitoring
Real-time CPU, GPU, and SSD temperature tracking with color-coded displays (cold, normal, warm, hot)
⚡ System Performance
Live CPU usage, memory consumption, and storage metrics with dynamic progress bars
🌀 Thermal Management
Thermal state monitoring (Normal/Fair/Serious) with fan speed gauge (800-7200 RPM)
🔋 Battery Status
Battery level, charging status, and health monitoring with visual indicators
📡 Network Monitoring
WiFi and Bluetooth connectivity status with upload/download speed tracking
📊 Performance Charts
Interactive real-time charts for CPU, temperature, and memory trends
🏗️ Technical Architecture
Technology Stack
Core Components
- SystemDashboard: Main orchestrator component managing all system metrics and real-time updates
- TemperatureGauge: Circular gauge component for temperature visualization with color coding
- Speedometer: Fan speed display with RPM tracking (800-7200 range)
- SystemChart: Interactive charts using Recharts for performance trends
- Progress Components: Custom progress bars with dynamic color coding based on usage levels
🎨 Feature Sections
Section 1: Internal Temperature
- CPU Temperature monitoring with color-coded gauge
- GPU Temperature tracking
- SSD Temperature display
- Thermal State indicator (Normal/Fair/Serious) with dynamic colors
- Fan Speed speedometer (800-7200 RPM) with color transitions
Section 2: CPU, RAM, & Storage
- Real-time CPU usage percentage with 8-core monitoring
- CPU frequency display (GHz)
- Memory usage tracking (used/total GB)
- Memory pressure indicator
- Storage visualization with dual-color bar (green for free, red for used)
- Dynamic color coding based on usage thresholds (green < 50%, orange < 70%, red < 85%)
Section 3: Network & Connectivity
- WiFi status with connection indicator
- Bluetooth status with device count
- Upload speed monitoring (Kbps/Mbps)
- Download speed tracking (Kbps/Mbps)
- Real-time network data transfer visualization
Section 4: System Performance Charts
- CPU usage percentage over time
- Temperature trends graph
- Memory consumption timeline
- Interactive chart with hover details
🎨 Design System
Color Palette
Background
Primary: #171f66
Secondary: #1c2473
Temperature Colors
Cold: Blue
Normal: Green
Warm: Orange
Hot: Red
Status Indicators
Charging: Orange
Battery: Grey
Live: Green (pulsing)
Connected: Green dot
UI Components
- Circular temperature gauges with gradient fills
- Progress bars with dynamic color transitions
- Pie chart for storage visualization
- Speedometer gauge for fan speed
- Badge components for status indicators
- Card-based layout with glassmorphism effects
- Responsive grid system
⚡ Real-time Data Management
Update Mechanism
The dashboard implements a sophisticated real-time update system using React's useEffect hook with a 2-second interval. Data points are dynamically calculated with realistic variations to simulate actual system behavior.
Monitored Metrics
- CPU usage (10-90% range)
- CPU temperature (35-85°C range)
- Memory usage (4-15 GB range)
- Fan speed (800-7200 RPM)
- Battery level (15-100%)
- Disk usage with calculated free space
- Network upload/download speeds
📊 Project Statistics
🚀 Development Journey
Completed Features
- Custom color scheme implementation (#171f66 background, #1c2473 cards)
- Network speed units conversion (Kbps/Mbps)
- Split system performance into 3 separate graphs (CPU %, Temperature, Memory)
- Pie chart visualization for storage
- Live indicator with green pulsing animation
- Dynamic thermal state colors (Normal=Green, Fair=Orange, Serious=Red)
- Charging/Battery status with color differentiation (Orange/Grey)
- Fan speed with dynamic color coding (red warning at 2000+ RPM)
- Removed generic WiFi network names and Bluetooth device counts
- Consolidated CPU, RAM, and Storage into single section
- Storage bar with dual-color visualization (green/red)
Planned Enhancements
- Weather section integration with Open-Meteo API for Munich
- Performance optimizations and code cleanup
- Additional chart types and visualizations
- Disk I/O monitoring
- Enhanced mobile responsiveness
- Export/sharing features
- Settings and preferences panel
- Historical data tracking
💡 Technical Highlights
Type Safety
Full TypeScript implementation with strict type checking and interface definitions for all system data
Component Architecture
Modular component design with clear separation of concerns and reusable UI elements
State Management
React hooks-based state management with efficient re-rendering and update cycles
Responsive Design
Mobile-first approach with Tailwind CSS grid system and breakpoint management
Performance
Optimized rendering with React.memo and efficient update intervals for smooth animations
Accessibility
ARIA labels, semantic HTML, and keyboard navigation support throughout the interface
📦 Key Dependencies
Core Libraries
React Ecosystem
react: 18.3.1
react-dom: 18.3.1
react-router-dom: 6.30.1
react-hook-form: 7.61.1
UI Framework
@radix-ui: Multiple components
tailwindcss: 3.4.17
lucide-react: 0.462.0
class-variance-authority: 0.7.1
Data Visualization
recharts: 2.15.4
Custom gauges and charts
SVG-based visualizations
State & Forms
@tanstack/react-query: 5.83.0
zod: 3.25.76
@hookform/resolvers: 3.10.0
🚀 Getting Started
Installation
Available Scripts
- npm run dev: Start Vite development server
- npm run build: Build for production
- npm run build:dev: Build in development mode
- npm run lint: Run ESLint
- npm run preview: Preview production build
🎯 Key Design Decisions
Color-Coded Feedback System
Implemented intuitive color coding throughout the interface to provide instant visual feedback on system health. Temperature ranges, usage percentages, and status indicators all use consistent color schemes (green=good, orange=warning, red=critical).
Real-time Simulation
While designed for real system data integration, the current implementation uses intelligent simulation with realistic value ranges and variations to demonstrate functionality and user experience.
Modular Component Architecture
Each visualization component (gauges, charts, speedometers) is self-contained and reusable, making it easy to add new metrics or modify existing ones without affecting other parts of the dashboard.
Performance-First Approach
Optimized update intervals (2 seconds) balance real-time responsiveness with system resource usage, ensuring smooth animations without overwhelming the browser.
🗺️ Future Roadmap
Phase 1: Core Enhancements
- Integration with actual system APIs for real data
- Weather widget for Munich using Open-Meteo API
- Historical data tracking and storage
- Customizable update intervals
Phase 2: Advanced Features
- Disk I/O monitoring and visualization
- Process-level monitoring
- Alert system for critical thresholds
- Export data to CSV/JSON
- Screenshot/share functionality
Phase 3: Customization
- Theme customization (light/dark modes)
- Widget arrangement and sizing
- Custom color schemes
- Configurable metrics and thresholds
- Multi-language support
Phase 4: Platform Expansion
- Desktop application (Electron)
- Mobile companion app
- Remote monitoring capabilities
- Multi-device dashboard
🔧 Challenges & Solutions
Challenge: Real-time Updates
Solution: Implemented efficient useEffect hooks with cleanup functions to prevent memory leaks and ensure smooth updates every 2 seconds.
Challenge: Color Coding Logic
Solution: Created utility functions that dynamically calculate colors based on value thresholds, ensuring consistent visual feedback across all metrics.
Challenge: Responsive Layout
Solution: Leveraged Tailwind's grid system with auto-fit and minmax for fluid layouts that adapt seamlessly to different screen sizes.
Challenge: Performance Optimization
Solution: Used React's optimization techniques and limited update frequency to maintain 60fps animations while updating multiple metrics.
📚 Learning Outcomes
- Advanced React hooks patterns for real-time data management
- TypeScript interface design for complex system data structures
- SVG manipulation for custom gauge and chart components
- Tailwind CSS advanced techniques for dynamic styling
- Performance optimization strategies for real-time dashboards
- Component composition and reusability patterns
- Color theory application for data visualization
- Responsive design principles for dashboard layouts
💻 Code Highlights
Dynamic Color Calculation
Temperature Gauge Component
Network Speed Formatting
📈 Project Metrics
🙏 Acknowledgments
shadcn/ui
Comprehensive UI component library built on Radix UI primitives
Recharts
Powerful charting library for React applications
Tailwind CSS
Utility-first CSS framework for rapid UI development
Lovable Platform
Development platform for rapid prototyping and deployment
🎓 Conclusion
The MacBook Pro Monitor project represents a comprehensive system monitoring solution that combines elegant design with powerful functionality. Built with modern web technologies and best practices, it provides real-time insights into system performance through an intuitive, color-coded interface.
The project demonstrates proficiency in React development, TypeScript implementation, real-time data management, and responsive design principles. With a solid foundation in place, the dashboard is well-positioned for future enhancements including actual system API integration, historical data tracking, and advanced customization options.
Key Takeaway: This project showcases the ability to create sophisticated, data-driven web applications with attention to user experience, performance, and visual design. The modular architecture and clean code structure make it an excellent foundation for continued development and feature expansion.